
 Contribute to YELL
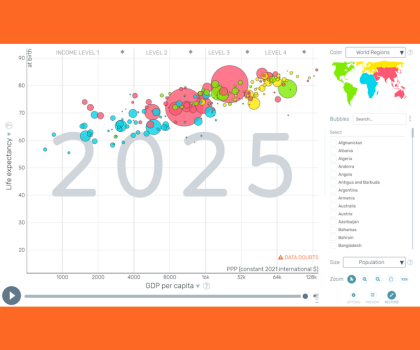
An interactive, multidimensional data visualization platform where older students and adults cross-analyze carbon dioxide emissions per capita against national income levels over historical timelines.
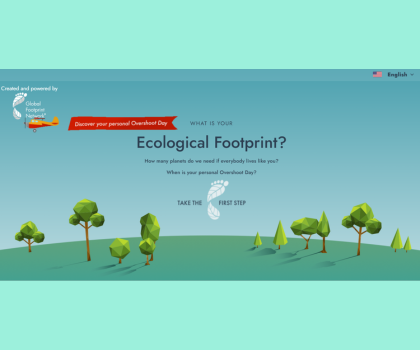
An interactive lifestyle analysis tool where adults input real-world habits across housing, diet, and travel to calculate their personal carbon footprint and Earth Overshoot Day.
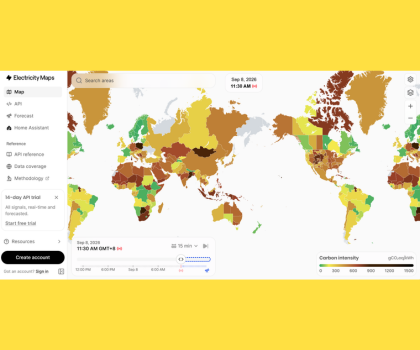
An interactive live data dashboard tracking the real-time carbon footprint, power generation mix, and cross-border electricity flows of regional power grids globally.
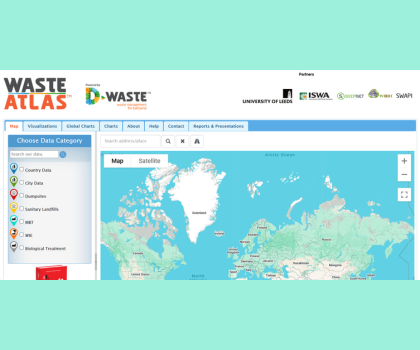
An interactive, crowd-sourced global mapping dashboard that visualizes municipal solid waste generation, disposal methods, and recycling rates across countries and cities for professional comparison and benchmarking.
To learn more, including how to change your settings, see our Cookies Policy.